PaPIM code performance analysis
Two independent performance analyses of the PaPIM code are reported below. They were conducted by Dr. Liang Liang (Maison de la Simulation and IDRIS), and by Dr. Alan O’Cais (Juelich Supercomputing Center), respectively.
A strong scaling analysis of the PaPIM code using the
Scalasca analysis tools, and the internal
PaPIM code calculation time outputs was conducted on the  system and performed
on the JURECA
cluster at the JSC.
Figure 1 displays the results of the performed tests.
system and performed
on the JURECA
cluster at the JSC.
Figure 1 displays the results of the performed tests.
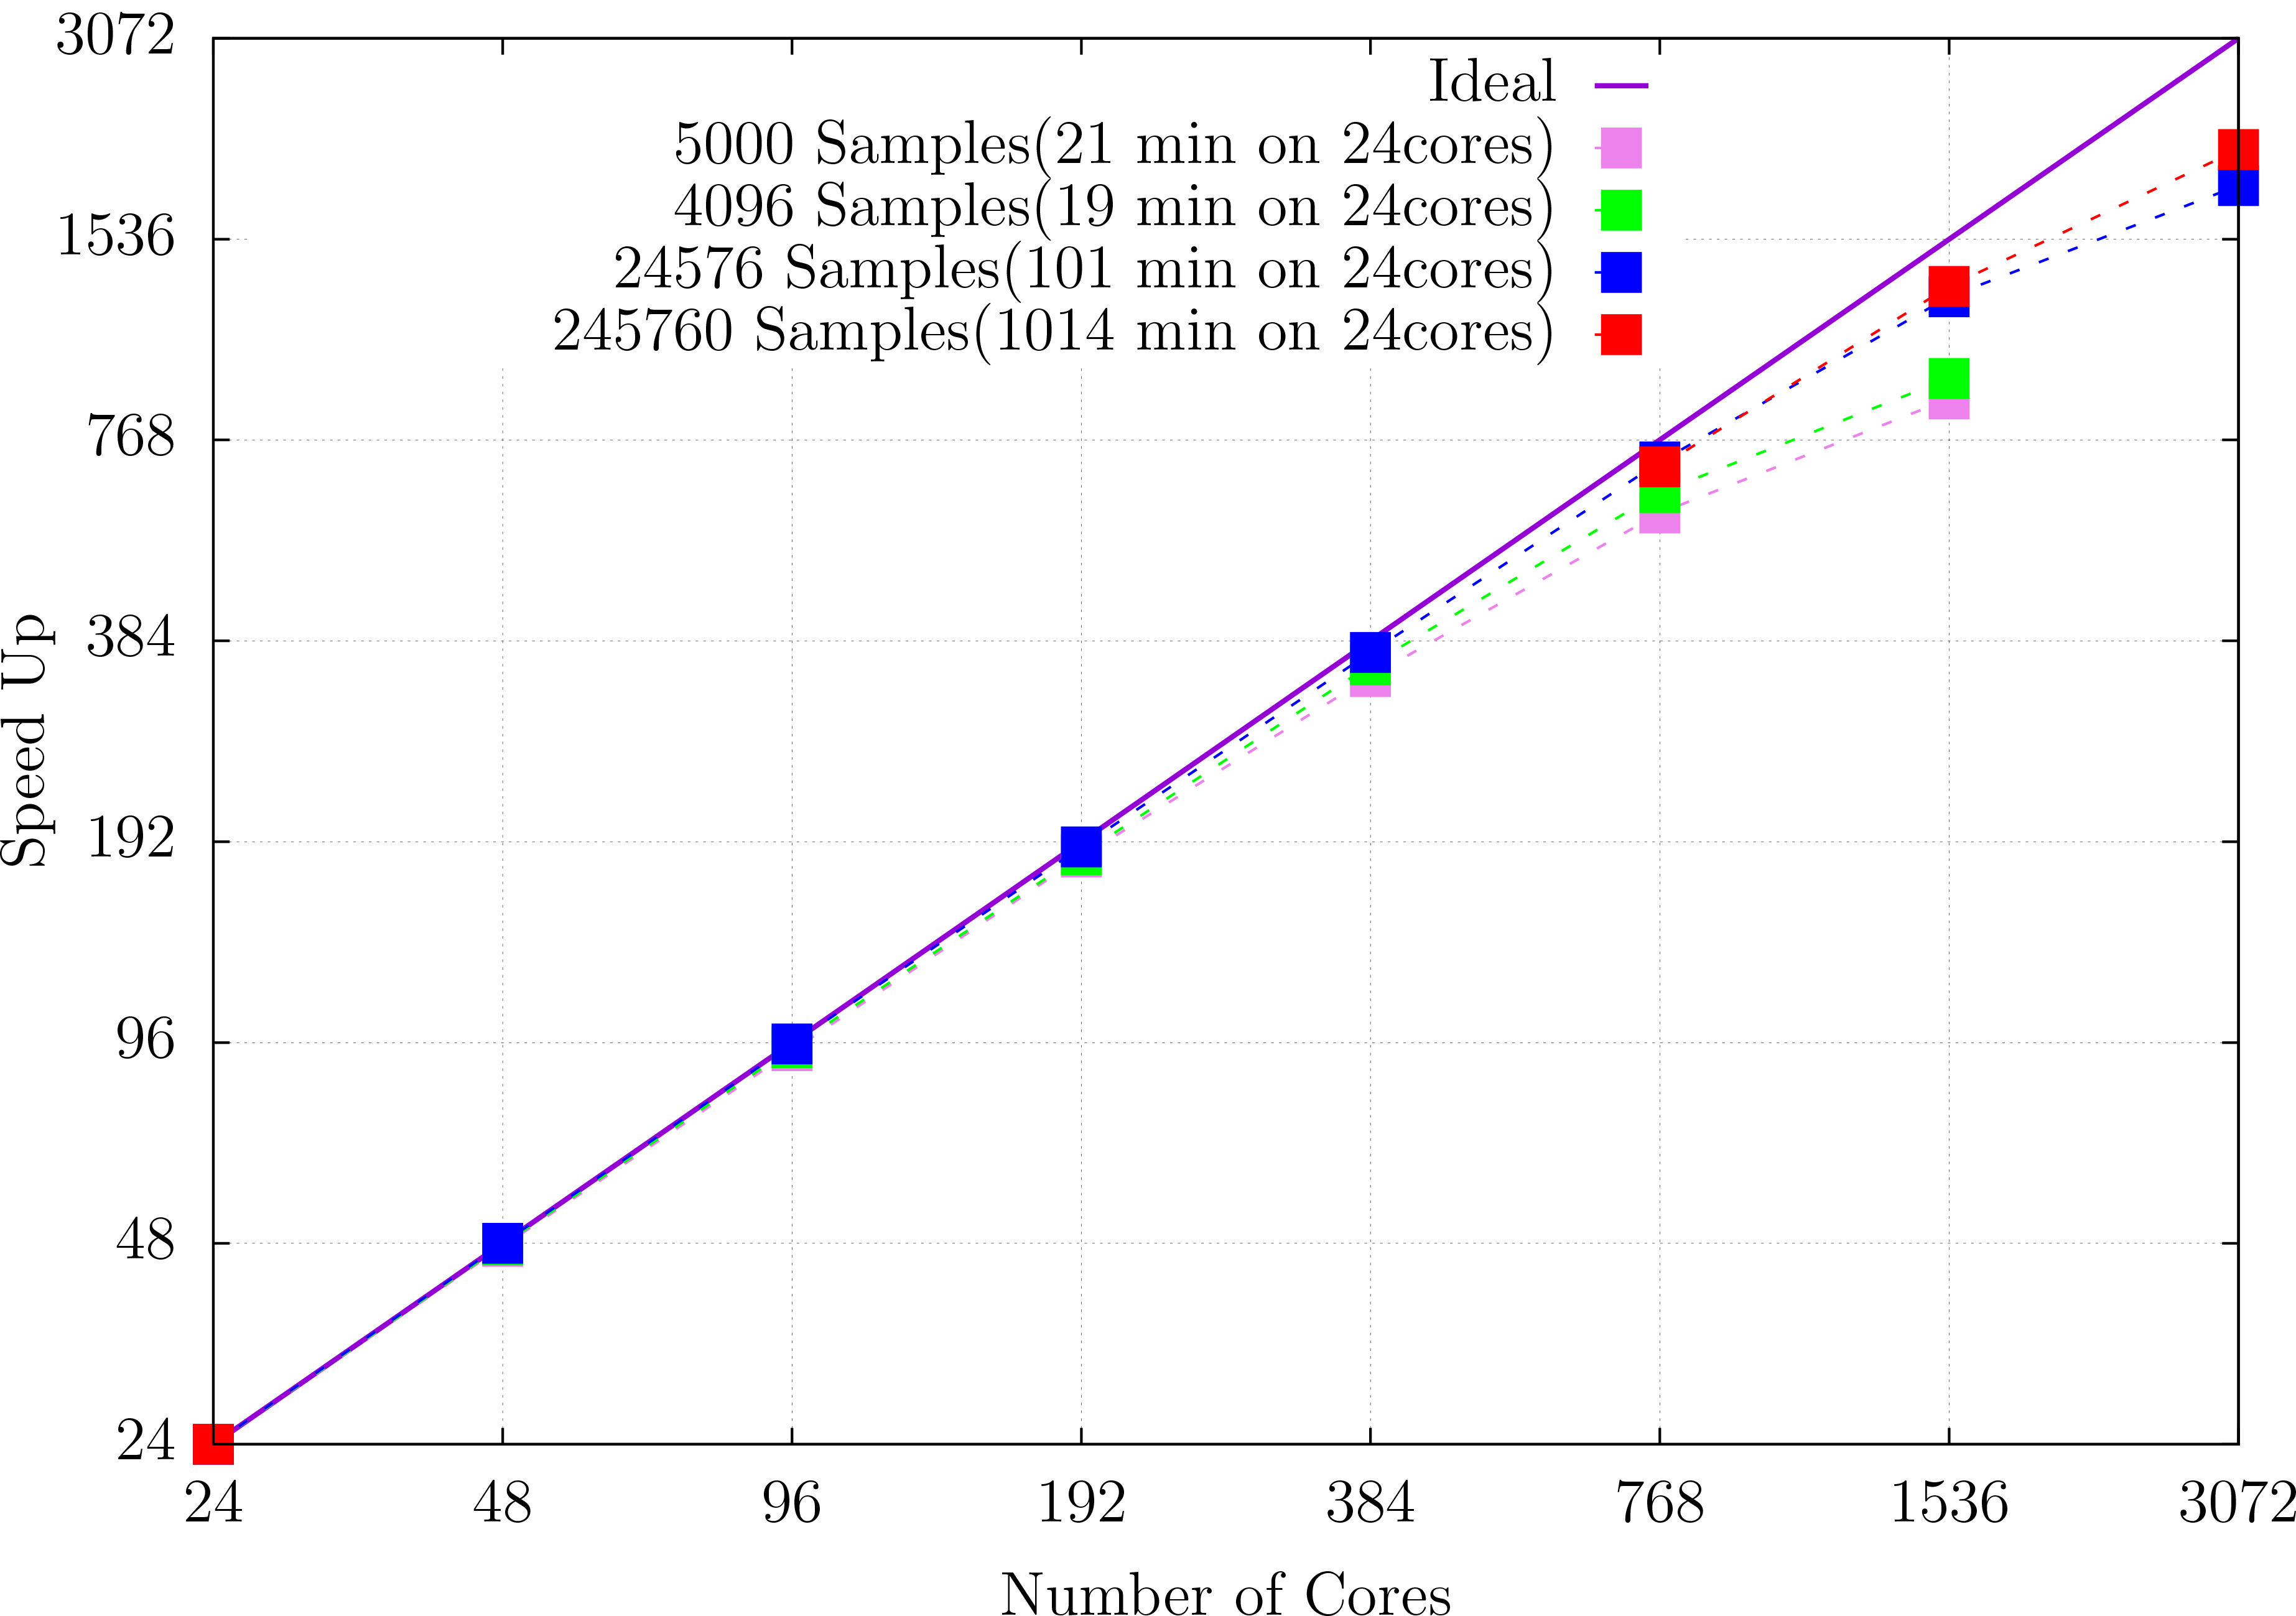
Fig. 1 Figure 1: PaPIM strong scaling test.
A parallel efficiency test was made on the JUQUEEN
cluster at JSC also using the system.
Results are displayed in Figure 2.
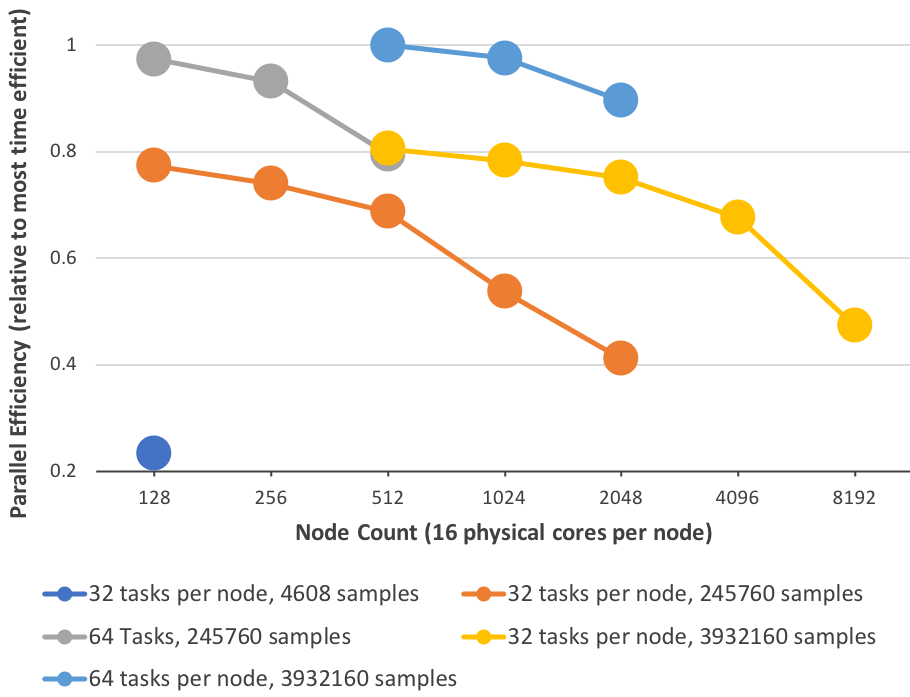
Fig. 2 Figure 2: PaPIM parallel efficiency test.
PaPIM scaling performance increases by increasing the number of sampling points.
Up to date the PaPIM code has been successfully run on 131,072 processor cores at JUQUEEN.